How Fast (or Slow) Until a Data-driven Swing Replaces an “Old School” One? (Baseball Analytics Shenanigans)

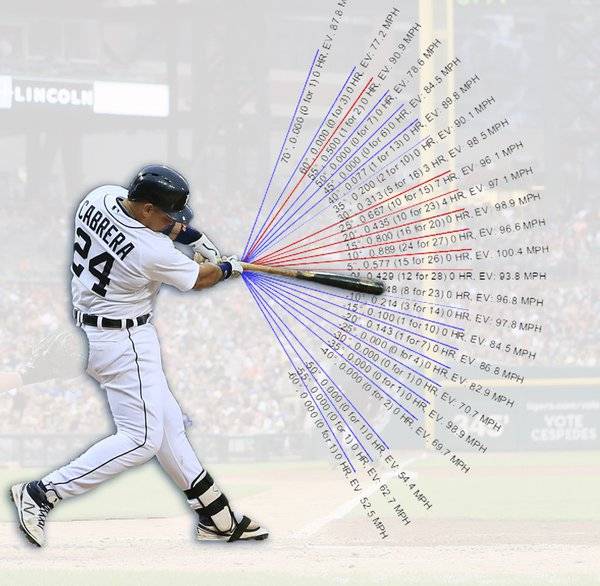
Baseball Analytics Photo courtesy: HittingNow.com
Why extremes are ALMOST never good
(Estimated reading time: 18-minutes)
Has the new way of baseball analytics changed baseball in 2022? Or are they ruining sports? I want to present a how to guide that translates data science metrics into hitting mechanics. Old school versus new school.
How did we get here with baseball analytics? The ‘Launch Angle’ era. Where did it originate? What was the tipping point of choosing Sabermetrics over traditional scouting? You’ll find out in the coming post. But first,
We’ll be discussing what a data-driven swing looks like – we’ll be covering:
- Story of Minor League hitting coaches having almost ZERO hitting experience,
- Pros of a data-driven swing,
- Cons of a data-driven swing, and
- How it’s bad (or good) to track ball exit speed and launch angle in the batting cage.
Once upon a time in the Minors…
Story of Minor League hitting coaches having almost ZERO hitting experience
I have an interesting story to talk about. A true story. In an almost magical land called the Minor Leagues. At the time, a little birdy playing for a National league professional organization whispered in my ear. This little birdy told me…
SCIENCE-BASED TRAINING:
Improve your hitting strategy dramatically by applying human movement principles.
Learn not only how and what to train but also the science behind the methods.
Their are budding baseball analytics hitting coaches sprouting up in some professional organizations – having almost zero hitting experience. No this isn’t fake news. These whirlybird propeller seeds are traveling by wind from the sparkling land of economics … planting their baby hitting coach seeds in fresh dark batter’s box soil. With a little gray water, bright sunlight, and the swift tap of a fairy’s wand… instantly sprouts an economics hitting fairy!
These magical Econ-hitting fairies are now happily coaching professional hitters on what they need to be feeling as a hitter … regardless of whether they’re hitting line drive after line drive … AND, with no more playing experience than Little League. Imagine the Mathlete schooling the High School Baseball Jock in everything hitting. And the Jock MUST listen or … YOU’RE FIRED!
Okay, so I may have embellished the story a bit. The Minor Leagues ARE NOT magical lands – just ask any Minor Leaguer. It wasn’t a little birdy that shared the story – it was a professional baseball human being. And sorry to kill your hopes and dreams, but magical Econ-hitting fairies aren’t born by adding gray water, sun, and the tapping of a fairy wand. C’mon man, everyone knows those aren’t real! Magical Econ-hitting fairies, I mean. Fairy wands are VERY real.
It is true though – how this story sounded in my head. It was an interesting story coming from a single-A ballplayer. That is, the state of professional baseball in the so-called ‘Launch Angle’ era. It does beg the question…
How are these baseball analytics Econ-hitting fairies, who have zero college, professional, or Major League experience, finding themselves coaching professional hitters on what they need to be doing, and how they need to be doing it? Listen, this may sound counter to what I just spent a few sarcastic paragraphs mocking. But listen closely…
As a coach you DO NOT need to have extensive experience to teach hitters to be effective in their movements. Just as long as you understand how to apply human movement principles that are validated by real science to hitting the ball. In other words, as long as you understand the rules of the human movement game, you can help hitters at all levels succeed, regardless of experience.
So what is happening?
From my understanding, these data-driven Econ-hitting fairies with extensive backgrounds in economics DO NOT understand the rules of the human movement game. Let me take you back to the future…
For those with your head in the sand the last two decades, there’s been a revolutionary baseball movement since 2001. Just after Michael Lewis wrote Moneyball. You may or may not have read the book, but may have seen the movie starring the always dreamy Bradley Pitt.
At the heart of the story is former General Manager of the Oakland Athletics, Billy Beane (played by Bradley Pitt). Beane reached out to Paul DePodesta, a Harvard alum, with a background in economics. And coincidentally had a knack for baseball statistics. DePodesta would soon become Beane’s first analytics department.
And it was here, Billy Beane transformed a low budget, bottom of the barrel, SEEMINGLY professional franchise known as the Oakland Athletics, into a real David and Goliath story. Beane and DePodesta used key player statistics to recruit. Stats that optimized scoring more runs, and as a result would win more games. Like how often a hitter gets on base – or On-base Percentage. And how often a hitter gets an extra base hit – known as Slugging Percentage. Think about it. How do you score more runs? Get more runners on base, and have hitters who can drive them in. Nowadays there are more advanced stats that measure run scoring value, but the point is this changed the game forever. For the better, and for the worst. I’ll get into why in the coming pages.
Furthermore…
This helped the baseball analytics powered A’s be highly competitive against top budget franchises. I apologize, but I’m going to spoil the ending … this was until other big market teams caught on. Oops! The cat was out of the bag. Yuge budget teams like Boston and New York were able to take the same system, but now pay BIG sums of money for the same undervalued players Oakland was getting at a steep discount. Yes, Oakland shot themselves in the foot. It wouldn’t be the last time. The jig was up. The A’s magic run was over. But not before Billy Beane and the A’s proved the system worked. Regardless of a franchise’s budget. Like a fairy’s wand, player valuation metrics transformed the game.
And it was a good thing at the time, because you had players and coaches still in the game or retired, that were helping teach the game through their personal experiences. They’re now considered “old school” coaches. Filling a gap on the coaching side of things that the Econ majors and analytics departments weren’t able to do. It was a healthy debate between old and new school methods. Friction and debate in a system are a good thing. But now this friction is like the political climate between Republicans and Democrats. Toxic.
This healthy balance of baseball analytics debate went MIA somewhere along the way. Like crabgrass in your lawn, metrics soon took over. Pushing many of the experienced baseball minds out of the game. Labeling them dinosaurs. Or maybe, the experienced minds couldn’t keep up. Or didn’t want to keep up. In my humble opinion, player valuation using metrics has its place. But it should not be the totality of scouting, recruiting and developing players. I’m not a Math-hater or numbers-denier. I love Math. Love Geometry, Economics, and Statistics. I did hate Algebra 2 though. My point is, data without context is not optimized. Data is a puzzle piece. NOT the whole thing.
Teaching hitters isn’t just about metrics. Doesn’t have to be completely data-driven. AND, teaching isn’t just about old school teaching methods. It’s a blend of both. Mutually inclusive. Not mutually exclusive. We can use data AND we can also use old school teaching methods to help hitters at all levels. We don’t have to be on one side or the other. You don’t have to be Tom OR Jerry. Bert OR Ernie. Han Solo OR Chewbacca. When it comes to hitting, the following will replace ‘Or’ with ‘And’.
Let’s make the Mathletes happy and discuss the…
Pros of a data-driven swing
Here are some pros to a data driven baseball analytics swing. Famed business management consultant, Peter Drucker once said,
“You can’t manage what you can’t measure.”
You business owners and managers understand this. You understand that you can optimize certain operations. You can optimize certain metrics in a business, it could be using Profit First in finances, it could be building Software as a Solution (SaaS) in technology, it could be optimizing sales funnels in marketing. Optimization is working on the right things, and then doing those things right.
How can numbers help hitters? Swing experiments. In online marketing, we can run what’s called split A/B test. Meaning, we can test whether a green button gets more clicks than a pink one over a period of time. Like online marketing, we can split A/B test the swing by running swing experiments.
One of the things we used to accomplish this, when we started HittingPerformanceLab.com back in 2013, was technology such as the Zepp swing app, a knob tech swing analyzer. Like BlastMotion and SwingTracker today. We can compare key swing metrics, whether it’s bat speed, attack angle, or time to impact and contrast two different swing movements. It’s the ultimate baseball analytics split A/B test for hitters!
Here are the 5 steps to applying the Scientific Method to running swing experiments…
We start off with a QUESTION: “Are loose hands fast hands to a hitter?” We can do a swing experiment using a BlastMotion or SwingTracker bat knob sensor. And we can test that. We can test it comparing apples to apples.
We then form a HYPOTHESIS on how we think the experiment will turn out: “I think loose hands ARE fast hands”. And then,
We go down the rabbit hole of RESEARCHING other studies that confirm and deny our hypothesis.
Then we COLLECT THE DATA from using the Zepp, BlastMotion, SwingTracker, or a PocketRadar for measuring ball exit speed.
For example in our ‘loose hands are fast hands’ swing experiment … we would take one hundred swings with loose hands. And one hundred swings doing the opposite. In this case, using what we call finger pressure. So the top hand, bottom three fingers squeezed tight, eight out of ten squeeze, from the moment the hitter picks up their front stride foot, to the swing follow through. Then we counterbalance those swings. This helps remove any warm-up or getting tired biases out of the experiment.
We break the two hundred swings into twenty five swing chunks, and layer them so that loose hand swings are symbolized with the letter ‘A’, and finger pressure swings are symbolized with the letter ‘B’. Remember, each letter represents one 25-swing chunk. The first 100 swings will be broken into the following sequence: ABBA. And the last 100 swings will be broken into the following reverse sequence: BAAB. This is how to do split A/B testing, from a hitting perspective.
After all 200 counterbalanced swings, we extract the averaged out data from the BlastMotion, SwingTracker, Zepp device, or PocketRadar. Then we can base our CONCLUSION on the averages. Which factor, loose hands or finger pressure swings contributed to better bat speed, hand speed, time to impact, attack angle, etc.? By the way, Finger Pressure won out in our own swing experiments.
Simply put, here’s the Scientific Method…
- Question
- Hypothesis
- Research
- Data
- Conclusion
Essentially, we use the above process, take one hitting myth, and test it against its opposite. Don’t get me wrong, no swing experiment is perfect. Experiment findings are based on probability. Experiments are repeated by others, and the findings are either proven or proven false. Over time, this increases or decreases confidence in the findings. The bottom line is this, using the Scientific Method may not be perfect, but it’s one step in the right direction. It gives us a process and path towards the truth. Take of from Peter Drucker: “You can’t manage what you can’t measure.”
We satisfied the Mathletes – somewhat – talking about the Pros of a data-driven swing, especially when it comes to Moneyball. Billy Beane, all that stuff.
Now, let’s make the old school athletes happy and look at the…
'Add 40-Feet' To Batted Ball Distance
Swing Study reveals how tens of thousands of hitters are adding 40-feet to batted ball distance by using one simple strategy.
Click the button below to access the FREE video that's been downloaded over 30K times!!
Click here to 'Get Instant Access'
Cons of a data-driven swing
Outside of applying the Scientific Method to optimizing the swing, here are the Cons to a baseball analytics data driven swing. Typically, in a data driven swing, not enough attention is given to the context of the numbers.
I always say, numbers don’t have brains. People do. Here’s the problem … take the example of our Econ-hitting fairy story. Knowing zero about hitting. Having virtually zero experience hitting. Teaching hitters based on hearsay. Basically guessing on connecting the dots. This presents quite a challenge. It would be like asking me to re-roof your house … I have a lot of skill sets, but that ain’t one of them! You’d be better off making YouTube your friend and doing it yourself!
In today’s game, these hitters are in the Big Leagues because their statistics work for ‘Launch Angle’ era Econ-scouts. On paper, the numbers work. Aaron Miles played 9-years in the Big Leagues, from 2003-2011. Played for almost half a dozen teams. Most notable, he played with Albert Pujols on the St. Louis Cardinals. He was a switch hitting middle infielder and third baseman. Standing in at 5-foot, 8-inches, 180-pounds. Beautiful .281/.320/.352 career average slash line (batting average/on-base percentage/slugging percentage). Note that he played when the baseball analytics ‘Launch Angle’ era was just getting warmed up. When there was a somewhat healthy balance of old and new school. That’s the context.
Let me set the scene…
I’ve had a few enjoyable phone conversations with Aaron Miles over the years. Great dude. Not afraid to challenge the status quo. He told me a pretty revealing story once. Which will say a lot about the hitting times we find ourselves in. I asked him what decision he made in the past that now – looking back – he sees was a mistake?
He was slumping one year, and was briefly demoted. Before the demotion, he knew he was a small-ball situational hitting guy being smaller, faster, and a switch hitter. But with the demotion, he didn’t have much to lose, so he decided to air out his swing. Again, this was the start of the ‘Launch Angle’ era. Interestingly, he began smashing more extra base hits. At one point, a coach came up to him saying something to the effect of, “C’mon Miles, you’re a role player, don’t swing beyond your role”.
Remember, at this time there was still a strong old school hitting mentality present in the game. So what did Miles do? What any rational, logical, smart Big Leaguer would do in that scenario … he got back to being a role playing hitter. You see, the respect for the “numbers community” wasn’t as high as it is now. So in Aaron’s case, old school hitting was more representative of the times.
Here’s the point…
Here’s how Aaron Miles answered the question of what decision he made in the past that now – looking back – he sees was a mistake… In this day and age of rewarding hitters that get on base more often and get more extra base hits … he expressed that he would have given the “air-it-out” swing more time. Maybe he could have added another year to his career. Maybe 2? 3? 4 maybe? Who knows! Give up some strikeouts. Hit more dingers and doubles. This formula seems to work out better for hitters in the Launch Angle era.
Let me be clear. This blog post isn’t about giving up a hundred strikeouts and fifty batting average points a season to hit for more power. What we believe is having your cake and eating it too! Power AND average. Mutually inclusive, NOT mutually exclusive. Just like Batman AND Robin!
Getting back to our baseball analytics Econ-hitting fairy friends taking numbers out of context…
They’re looking at a hitter’s high ground ball percentage – say 50 percent, while league average is 43 percent. And they’re telling that hitter to get the ball in the air. You may agree with this. And I can see where you’re coming from. But there’s a catch…those numbers don’t mean anything, if you don’t understand what mechanics are causing a higher than average ground-ball rate.
Let me give an example…
Christian Yelich in 2015 had a ground-ball rate of 62.5-percent! Remember league average is 43-percent. Then, that rate steadily dropped in the years that followed 56.5, 55.4, 51.8, and in 2019 he finally arrived at a league average 43.2-percent ground-ball rate. Do you know how many doubles he hit in those respective seasons, starting in 2015? 30, 38, 36, 34, and 29 doubles in 2019 – where he had about 100 less plate appearances than prior years. Dingers? Starting in 2015 with 7, 21, 18, 36, and 44 in 2019.
Yes, hitting less ground-balls will lead to more extra base hits. But what in a hitter’s mechanics (or timing) cause an above average ground-ball rate? Do you know? Off the top of your head, what can you point to mechanically? Believe me, if you tell a hitter to get the ball in the air without looking at mechanical ground-ball choke points, then you’ll most likely get an extreme uppercut. Not to mention, most young hitters will make unnatural compensations to get the ball in the air. This collapses consistency! Low batting average and high strikeouts will be the ultimate result. Believe me.
Baseball analytics numbers by themselves are dumb. Numbers don’t have brains, people do. So hitting coaches have to understand how mechanics translate into metrics. Back to our Econ-hitting fairy friends. That’s the problem. Not having the ability to translate metrics into mechanics. To optimize the numbers, we have to understand the context. The good news for our Econ-hitting fairy friends? This can be learned and applied in today’s ‘Launch Angle’ era. Regardless of playing level experience.
'Add 40-Feet' To Batted Ball Distance
Swing Study reveals how tens of thousands of hitters are adding 40-feet to batted ball distance by using one simple strategy.
Click the button below to access the FREE video that's been downloaded over 30K times!!
Click here to 'Get Instant Access'
How it’s bad (or good) to only track ball exit speed and launch angle in the batting cage
There are some hitting coaches that will say tracking ball exit speed and launch angles in the batting cage is really dumb, is REALLY not smart. And then there are those who do it all the time. And their hitters are successful versus doing nothing.
Look, I treat the batting cage as a Laboratory. It’s a place to experiment. To work out the kinks. To be free to make mistakes and learn. Use data to measure and manage swing mechanics. Logical coaches get this. Others? They’re just guessing.
Same polarized perspective about tee work. Some coaches don’t like hitting off batting tees. Because at the end of the day, the hitter has to translate what they’re doing mechanically to a LIVE pitch. Agreed. But when teaching something new, a batting tee has its place. It can also help coaches understand cause and effect in mechanics. How? By isolating the variable. If you can’t isolate the variable, you’re guessing. And guessing is an anti-optimization strategy. If you don’t know what’s causing what, then how do you know what works and what doesn’t?
Isolating the variable? Brilliant.org defines it:
“Isolating a variable means rearranging an algebraic equation so that a different variable is on its own. The goal is to choose a sequence of operations that will leave the variable of interest on one side and put all other terms on the other side of the equal sign.”
I know, rough definition when comparing against baseball analytics. Let me rephrase … in relation to hitting mechanics, it’s finding out what in the swing contributes to the majority of power… Hitting more line drives… Getting on-time more often… How would one go about isolating those mechanical variables? I can tell you it’s not hitting LIVE pitching. WHY? Because LIVE pitching is too random. Humans. Pitch speed. Pitch depth. Pitch height. Pitch type. Pitch distance. Pitch reaction time. All this can be controlled in a swing experiment off a tee.
I believe, there’s a time and place for the tee. I subscribe to the Goldilocks Golden Rule – not too hot, not too cold…I like my hitters using the tee just the right amount. The brain has to organize in a certain way. With LIVE pitching, there is a lot of data collection the hitter has to take in. Pitch recognition. Tracking. Timing. Learning a new mechanic also taxes the brain. High cognitive load.
Consider this…
What if I asked you to write your first and your last name in half the letters. In other words, what if I asked you to write every other letter of your name? So for me, JOEY MYERS, I would write it as J-E-M-E-S. Now, I’ve never done that before. So, if I was timing myself, the first five out of ten tries would be slow. The more I practice though, the faster I’d be writing half my name. Why? Because I’m writing it in half the letters!
But it takes a little time for my brain and body to connect and figure this out. To learn how to do it. Learn how to do something that I’m not used to doing. It is the same exact thing when learning something new mechanically. Keep this in mind when thinking about your seven, eight, nine year olds learning something they’re not comfortable doing. Hitting off the batting tee is an okay thing to do in the beginning. When something’s new.
Again, the batting tee shouldn’t be something you spend a lot of time using, but it is a proper regression-progression when compared to dry swings, soft toss, or LIVE toss. In connecting tee work to ball exit speeds and launch angles … they give us a unit of measure off the tee with a uniquely controlled environment. Apples to apples comparison.
Launch angles are a data point. A lot of these coaches don’t like the launch angle swing. Well, launch angle is a number. The launch angle is the angle of the ball coming off the bat. It’s hard for hitters to control it. However, hitters can control their barrel Attack Angle. The angle the barrel takes to the incoming pitch. Launch and Attack Angles don’t have to be the same. And most likely they aren’t going to be. But hitters can better control the latter, not so much the former.
What’s measurable is manageable. We can use swing experiments to do it. Hitting off the tee shouldn’t be something we hang our hat on, but it is something that gives us a data point, a standard data point that we can give baseball analytics context to. Not like analyzing metrics without looking at context. Remember numbers don’t have brains, people do. What are the causes of an above or below average fly ball, ground ball, or line drive percentage? Home run to fly-ball ratio? Higher percentage of pulling the ball or going the other way too much? What is the mechanical causation-correlation relationship making those metrics above or below average?
We’ll find out in upcoming blog posts…
We covered A LOT:
- Story of Econ-hitting fairies in the Minor Leagues – having almost ZERO hitting experience and knowledge. What’s going on here?
- Pros of a data-driven swing – what’s measurable is manageable. Using the Scientific Method: 1. Asking a question, 2. Forming a hypothesis, 3. Doing the research, 4. Collecting the data, and 5. Formulating a conclusion,
- Cons of a data-driven swing – numbers by themselves are dumb. Numbers don’t have brains, people do. Hitting coaches have to understand how mechanics translate into metrics. What does a hitter with an above average ground-ball rate mean? How do you bring him or her to average or below average? And…
- How it’s bad (or good) to track ball exit speed and launch angle in the batting cage – if you’re not collecting data and comparing with strategic swing changes, then you’re guessing. Tracking ball exit speeds, attack angles, and launch angles are part of data collection. And using a tee is essential when isolating the variable and teaching something new.
'Add 40-Feet' To Batted Ball Distance
Swing Study reveals how tens of thousands of hitters are adding 40-feet to batted ball distance by using one simple strategy.
Click the button below to access the FREE video that's been downloaded over 30K times!!
Click here to 'Get Instant Access'