
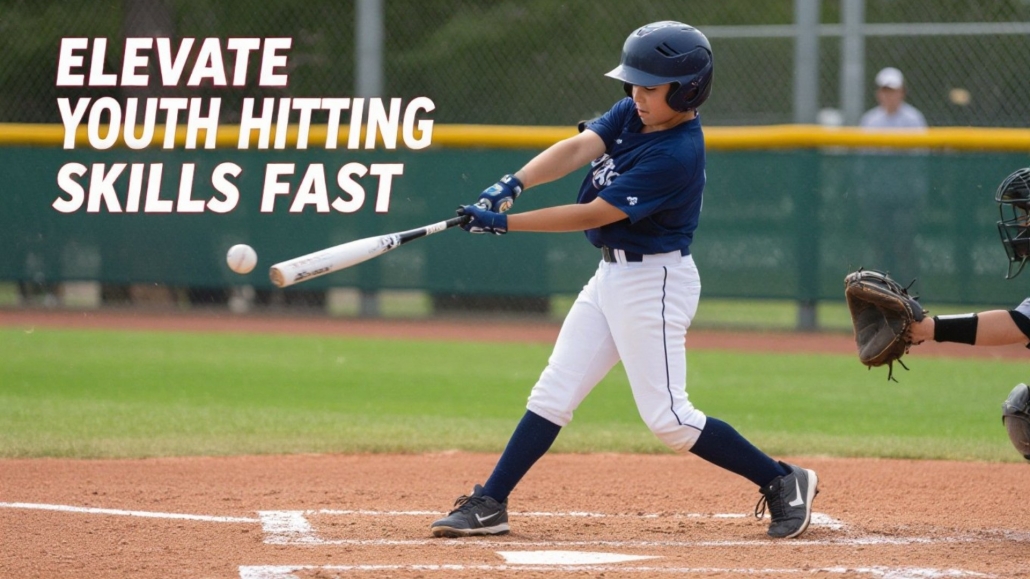
MLB Playoff-Proven 2-Zone Tee Drill & Pitch Selection Training for Youth Hitters’ Quality At-Bats

Stop Obsessing Over Batting Average: Smarter Youth Hitting Metrics for Real Progress
If your weekend ends with staring at a .210 batting average and wondering whether your hitter is “falling behind,” this post is for you. Batting average feels simple and decisive—but for youth baseball and softball it’s a noisy, incomplete snapshot. In this episode of the Swing Smarter Hitting Training Podcast, Joey Myers explains why average can mislead parents and coaches, and what to use instead so you actually measure growth and build confident, game-ready hitters. Apply the frameworks below and you’ll coach calmer, train smarter, and see the kind of progress that lasts beyond a lucky bloop single.
Why Batting Average Misleads Parents (and Can Hurt Development)
-
Binary math, not development. Average only counts hit vs. out. A smoked lineout and a flared single are treated as opposites even though one reflects superior swing quality.
-
Tiny samples, big mood swings. Youth seasons and tournaments are short. A couple of hard-hit balls at gloves can tank average and trigger bad mid-season “fixes.”
-
Confidence tax. When kids (and adults) overreact to average, they start pressing, chasing, and changing swings—exactly the behaviors that stall development.
Bottom line: Average is an outcome metric. Youth development thrives on process metrics.
What to Track Instead (Simple, Objective, and Game-Useful)
1) Quality Contact Percentage
How often did your hitter barrel/center the ball with a strong trajectory—regardless of result? Track hard line drives and well-struck fly balls as “quality.” Reward the process, not the luck.
Why it matters: It predicts future hits better than average and reinforces repeatable movement patterns (great for smaller, later-maturing athletes).
2) Pitch Selection Success
Did your hitter swing at strikes they can drive and lay off marginal pitches? Think green zone (damage), yellow zone (borderline/manage), red zone (take).
Why it matters: Better swing decisions = better count leverage, better contact, and less chase. As sports psychologist Dr. Bhrett McCabe would say, control the controllables—your decisions and approach.
3) Competitive At-Bats (C-ABs)
Did they battle with two strikes, extend the pitch count, put tough pitches in play, move runners, or punish mistakes?
Why it matters: C-ABs wear down pitchers, elevate the lineup, and build a hitter’s self-image around resilience and execution—not just outcomes.
A Coaching Framework You Can Run This Week: The Two-Zone Tee Game
Goal: Build decision-making, trajectory control, and confidence—fast.
Setup (5–7 minutes):
-
Tee set belt-high, middle-in or middle-away.
-
Mark two front-of-plate contact zones on the ground: Green (best launch window) and Yellow (borderline).
-
Use a notebook or notes app.
Round 1 – Green Zone (10 swings):
-
Cue: “Line drives through the L-screen.”
-
Score 1 point for loud line drives or well-struck loft.
-
Note feel cues (e.g., “top hand firm, bottom hand relaxed,” “ground-up explode”).
Round 2 – Yellow Zone (10 swings):
-
Cue: “Decide fast—manage or pass.”
-
If you’d take it in a game: no swing, +1 for discipline.
-
If you’d swing: +1 for controlled contact (not sell-out power).
Why this works: You’re rehearsing approach, not just contact. Over time, your notes reveal trends in quality contact %, selection success, and two-strike compete—the same core metrics that drive sustainable improvement.
Mindset That Protects Confidence (and Keeps Kids in the Game)
When the stat sheet bites, remember: your athlete can’t control whether a laser finds leather. They can control their plan, their swing decisions, and how they compete. Or as Marcus Aurelius put it, “You have power over your mind—not outside events.” Model that perspective as a parent or coach and you’ll shield your hitter from the emotional whiplash of short-term stats while reinforcing habits that win over a season, not an inning.
Real-World Snapshot (What Progress Actually Looks Like)
-
Case: 12U hitter with a .180 average midseason.
-
Quality-contact % doubled vs. previous season
-
Exit velocity up ~4 mph
-
Chase rate down; more swings in the green zone
-
Late-season surge as the “luck” caught up to the process
Lesson: Development was happening long before average turned north.
-
Quick-Hit Takeaways for Parents & Coaches
-
Replace “What was the average?” with “How many quality contacts did we have?”
-
Chart greens vs. yellows (swing decisions) for 2 weeks—you’ll spot patterns fast.
-
Count Competitive At-Bats after games; praise the fight, not just the hit.
-
Use the Two-Zone Tee Game 3–4x/week for 5–7 minutes. Consistency beats volume.
-
Protect identity: validate approach and effort first; outcomes second.
Internal Linking Suggestions (keep readers in your ecosystem)
Listen to the Full Episode
Ready to see what really moves the needle for your hitter? Listen to the full episode here
If this helped reframe how you read stats, share it with a coach or parent who needs a calmer, smarter lens. And if you want a simple plan to run at home this week, start with Swing Shift—turn quality-contact reps and better decisions into confidence that shows up on game day.

With 28,000+ online bat speed program sales, my methods have transformed coaches, instructors, and parents just like you. I'm affiliated with esteemed organizations like ABCA, IYCA, and SABR, advocating for positive coaching. With 15+ years in corrective fitness and a Division One baseball background, my knowledge is unmatched.
Join our blog and unlock the secrets to successful hitting, elevate your performance, and ignite your passion. Welcome to the world of limitless possibilities at HittingPerformanceLab.com.
- Fix Late Swings Fast: 2025 Pitch Recognition & See-Decide-Swing Training for Youth Baseball Power Hitters - October 6, 2025
- Safe Youth Weighted Bat Training: Proven Overload/Underload Drills to Increase Exit Velocity in Games Starting Tonight - September 29, 2025
- AI Coaching Course 2025: Youth Baseball & Softball Practice Plan + Off-Season & In-Season Workout Builder Fast - September 23, 2025