
Here Is A Formula That Is Helping Corey Seager Or Trevor Story Win NL Rookie Of The Year
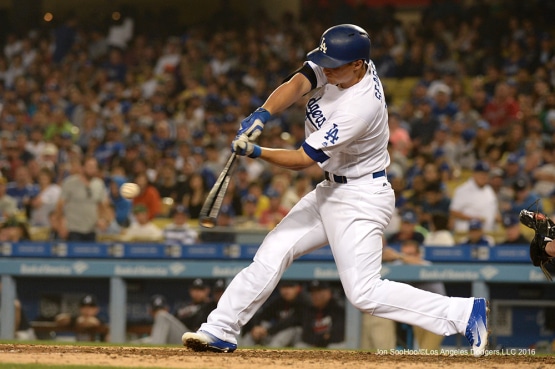
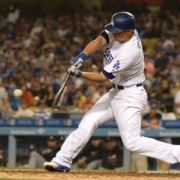
Corey Seager getting great knee action here, being slightly out front of the pitch. Photo by Jon SooHoo/© Los Angeles Dodgers,LLC 2016
I’ve been watching quite a bit of the Los Angeles Dodgers lately (because of my fanatic mother-in-law),
And am really impressed with Corey Seager’s swing, who’s 6’4″, 215-lbs (according to FanGraphs.com).
So I decided to do a comparison between a couple leading 2016 NL Rookie of the Year candidates, Seager and Trevor Story of the Colorado Rockies, who’s 6’1″, 175-lbs (according to FanGraphs.com).
Granted, at the time of this writing (8/23), Story has cooled down a bit, and is sitting on the Disabled List with a torn ligament in his thumb.
So, here’s what we cover in the Corey Seager v. Trevor Story hitting analysis video:
- Talking metrics,
- Catapult Loading System swing elements,
- Pitch-Plane Domination swing elements,
- Reaction Time Mastery swing elements, and
- Adjustments to off-speed or breaking stuff.
Talking Metrics
First let me define a couple of the metrics we’ll be looking at:
- ISO – Isolated Slug%, basically raw power, and
- BABIP – Batting Average on Balls In Play, a loose measure of how consistently a hitter hits the ball hard.
Okay, so now let’s compare their lines according to Fangraphs.com…
Corey Seager

Compliments of Fangraphs.com
And…
Trevor Story

Compliments of Fangraphs.com
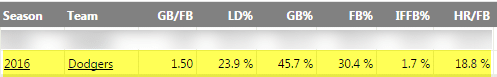
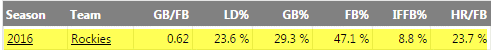
In comparing Corey Seager to Trevor Story’s metrics, you can see Seager has a bit more consistency baked into his swing, but Story has a bit more power…possibly due to the thin air in Colorado, I dunno, just sayin’. lol
And if you look at the percentages of:
- Ground-balls (GB%, league average is 44%),
- Line Drives (LD%, league average is 20%),
- Fly-balls (FB%, league average is 36%), and
- Homers to Fly-Balls (HR/FB, league average is 9.5%)…
…Between the two hitters, you can see there’s no secret to what Trevor Story is trying to do with his swing…get the ball in the air!! The thin air!
Corey Seager
And…
Trevor Story
NOTES about Video Analysis

Trevor Story getting a significant positive attack angle, one of the reasons he gets the ball in the air so well. Photo courtesy: Deadspin.com
The Corey Seager homers analyzed…
Game footage was from 8/8/2016 – 2 homers:
- 91-mph FB, down-middle
- 75-mph CB, down-middle
The Trevor Story homer analyzed…
Game footage was from 7/24/2016 – 1 homer:
- 81-mph CU, down-inner 1/3
The rest of the video, after discussing metrics, was looking at how well Corey Seager and Trevor Story used the following HPL formula:
- Catapult Loading System,
- Pitch-Plane Domination, and
- Reaction Time Mastery.
What’s interesting to note on adjustments to off-speed or breaking balls…both hitters “get shorter” and “stay shorter” to buy themselves some time, while also trying to “stay underneath” the ball.
Both Corey Seager and Trevor Story are great examples of the formula we use at HPL to help hitters triple their body-weight in batted ball distance…
They don’t have to hit all the ‘musical notes’, but definitely a majority.
It’s a great formula for winning NL Rookie of the Year 😉