
Discover the best baseball, fast-pitch, and slow pitch softball power batting drills to increase hitting bombs farther and improve keeping the front shoulder in. Also, where is Adrian Gonzalez now? He announced his retirement February of 2022.
Adrian Gonzalez: Power Secret You Are Missing?

Photo credit: MLB.com
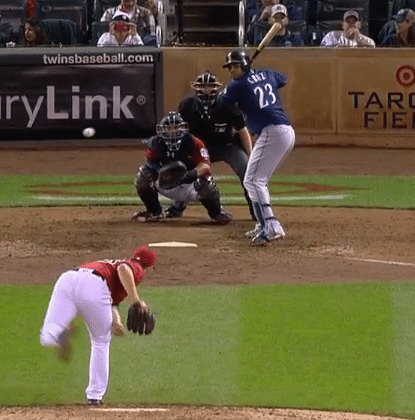
In the second installment to the Hitting Backwards: 4 Common Mistakes Hitters Make video series, starring Adrian Gonzalez, we discuss why “walking away from the hands” doesn’t make sense. A-Gon is a bigger hitter (*6’2″, 225lbs) who uses human movement science correctly to generate explosive rotational power.
*(According to Baseball-Reference.com)
We’ll use Adrian Gonzalez’s swing to talk about:
- The simple science of loading,
- How big hitters get away with ineffective mechanics, and
- The power secret you are missing.
Contrary to popular belief, “walking away from the hands” is NOT how we load properly. It decreases turning speed by arm barring. In the 2014 Sochi Winter Olympics, if controversial gold medal winning ice skater Adelina Sotnikova could turn faster by barring an arm out, then don’t you think you’d see her do that?
SCIENCE-BASED TRAINING:
Improve your hitting strategy dramatically by applying human movement principles.
Learn not only how and what to train but also the science behind the methods.
The Simple Science of Loading
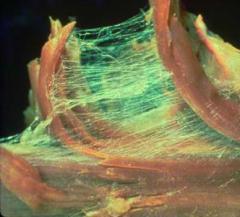
Photo credit: Thomas Myers
According to the book Anatomy Trains by Thomas Myers, the human body is loaded by connective tissue called Fascia, which is:
- A cotton candy-like material,
- To the body, like steel is to the building industry,
- Connective tissue your bones and muscles float in,
- Gives muscles their shape, and
- At a constant battle to balance compression and tension forces within the body…Thomas Myers calls this Tensegrity (Tension-Integrity)
Big Hitters Get Away with Ineffective Mechanics
We’re studying the wrong hitters. Pujols. Hamilton. Griffey Jr. Paul Goldschmidt.
Ken Griffey Jr. was the perfect example of “walking away from the hands”. People don’t realize, he succeeded despite ineffective mechanics, not because of them. Here are some other notable athletes getting away with ineffective mechanics:
- Kevin Durant, NBA’s leading scorer, succeeds despite flawed shooting mechanics. His knees crash in, which is called Knee Valgus.
- Tiger Woods succeeded despite being ineffective mechanically, later in his career (4 knee surgeries, in addition to numerous Achilles and back issues). CLICK HERE to read this “Muscle Power Golf, Not!” post about this.
- Numerous pitchers throw 95+mph despite career shortening flawed mechanics (Kerry Wood and Mark Prior just to name two)
Spend more time analyzing hitters like: Braun, Cano, David Wright, Jose Bautista, McCutchen, Hank Aaron, and Sadaharu Oh (Japan’s career home run leader). These small-sluggers have to move friction-free (or nearly) to compete. Big-sluggers with friction-free swings include: Miguel Cabrera, Adrian Gonzalez, David Ortiz, and Chris “Crush” Davis.
Power Secret You Are Missing
Of the nine fascial lines mentioned in Thomas Myers’ book Anatomy Trains
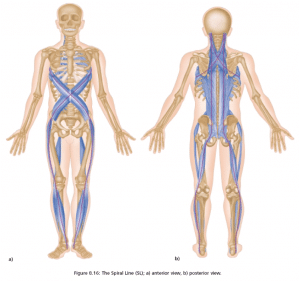
Photo credit: Thomas Myers
“The overall movement function of the SPL is to create and mediate spirals and rotations in the body, and, in eccentric and isometric contraction, to steady the trunk and leg to keep it from folding into rotational collapse.”
I call this the ‘Springy X Pattern’. Imagine an ‘X’ on the front and back of the torso. When one leg of the ‘X’ shortens, then the other stretches. Golf training expert Jason Glass of Jason Glass Performance calls these Rotational Power Slings.
Adrian Gonzalez “spring loads” his swing using what I call the Catapult Loading System (CLS). It takes the Stability ‘X’ Pattern or Rotational Power Sling concepts and applies them to hitting.
Here are a few other world-class spring loaded athletes who’s movements are very similar to a hitter’s:
- Golfers,
- Olympic Shot Putters
- Olympic Throwers – Javelin, Discus, and Hammer
- Lacrosse
CLICK HERE in case you missed Part-1 to the Hitting Backwards: 4 Common Mistakes Hitter’s Make video series. And CLICK HERE for Common Mistake #3, where we look into why a friction-free hitter SHOULD NOT land with the front toe closed…

 (Thomas Myers),
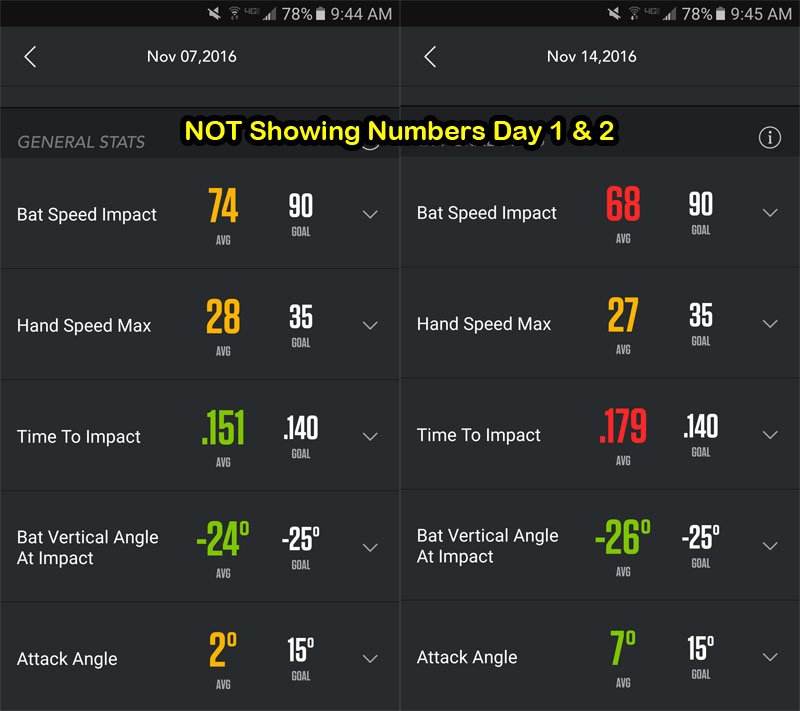
  (Dr. Serge Gracovetsky), and from my past swing experiment, I expect to see similar results…maybe even slightly lower numbers favoring ‘Showing Numbers’.
 (to measure Ball Exit Speed, or BES),